
"If Only Cranks Find The Election Tabulations Strange, Put Me Down As A Crank..." Tyler Durden Sun, 11/29/2020 - 22:30
Authored by Patrick Basham via The Spectator,
Reasons why the 2020 presidential election is deeply puzzling
To say out-loud that you find the results of the 2020 presidential election odd is to invite derision. You must be a crank or a conspiracy theorist. Mark me down as a crank, then.
I am a pollster and I find this election to be deeply puzzling. I also think that the Trump campaign is still well within its rights to contest the tabulations. Something very strange happened in America’s democracy in the early hours of Wednesday November 4 and the days that followed. It’s reasonable for a lot of Americans to want to find out exactly what.
First, consider some facts.
President Trump received more votes than any previous incumbent seeking reelection. He got 11 million more votes than in 2016, the third largest rise in support ever for an incumbent. By way of comparison, President Obama was comfortably reelected in 2012 with 3.5 million fewer votes than he received in 2008.
Trump’s vote increased so much because, according to exit polls, he performed far better with many key demographic groups. Ninety-five percent of Republicans voted for him. He did extraordinarily well with rural male working-class whites.
He earned the highest share of all minority votes for a Republican since 1960. Trump grew his support among black voters by 50 percent over 2016. Nationally, Joe Biden’s black support fell well below 90 percent, the level below which Democratic presidential candidates usually lose.
Trump increased his share of the national Hispanic vote to 35 percent. With 60 percent or less of the national Hispanic vote, it is arithmetically impossible for a Democratic presidential candidate to win Florida, Arizona, Nevada, and New Mexico. Bellwether states swung further in Trump’s direction than in 2016. Florida, Ohio and Iowa each defied America’s media polls with huge wins for Trump. Since 1852, only Richard Nixon has lost the electoral college after winning this trio, and that 1960 defeat to John F. Kennedy is still the subject of great suspicion.
Midwestern states Michigan, Pennsylvania, and Wisconsin always swing in the same direction as Ohio and Iowa, their regional peers. Ohio likewise swings with Florida. Current tallies show that, outside of a few cities, the Rust Belt swung in Trump’s direction. Yet, Biden leads in Michigan, Pennsylvania, and Wisconsin because of an apparent avalanche of black votes in Detroit, Philadelphia, and Milwaukee. Biden’s ‘winning’ margin was derived almost entirely from such voters in these cities, as coincidentally his black vote spiked only in exactly the locations necessary to secure victory. He did not receive comparable levels of support among comparable demographic groups in comparable states, which is highly unusual for the presidential victor.
We are told that Biden won more votes nationally than any presidential candidate in history. But he won a record low of 17 percent of counties; he only won 524 counties, as opposed to the 873 counties Obama won in 2008. Yet, Biden somehow outdid Obama in total votes.
Victorious presidential candidates, especially challengers, usually have down-ballot coattails; Biden did not.
The Republicans held the Senate and enjoyed a ‘red wave’ in the House, where they gained a large number of seats while winning all 27 toss-up contests. Trump’s party did not lose a single state legislature and actually made gains at the state level.
Another anomaly is found in the comparison between the polls and non-polling metrics. The latter include: party registrations trends; the candidates’ respective primary votes; candidate enthusiasm; social media followings; broadcast and digital media ratings; online searches; the number of (especially small) donors; and the number of individuals betting on each candidate.
Despite poor recent performances, media and academic polls have an impressive 80 percent record predicting the winner during the modern era. But, when the polls err, non-polling metrics do not; the latter have a 100 percent record. Every non-polling metric forecast Trump’s reelection. For Trump to lose this election, the mainstream polls needed to be correct, which they were not. Furthermore, for Trump to lose, not only did one or more of these metrics have to be wrong for the first time ever, but every single one had to be wrong, and at the very same time; not an impossible outcome, but extremely unlikely nonetheless.
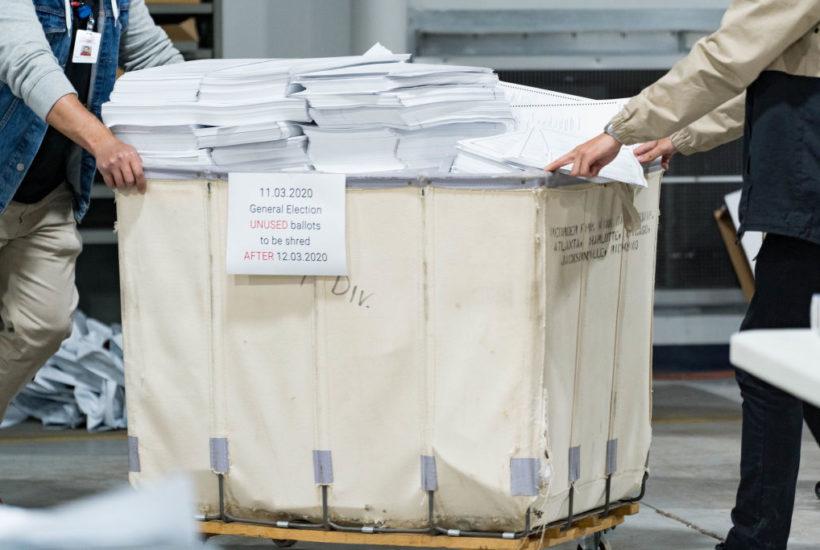
Atypical voting patterns married with misses by polling and non-polling metrics should give observers pause for thought. Adding to the mystery is a cascade of information about the bizarre manner in which so many ballots were accumulated and counted.
The following peculiarities also lack compelling explanations:
1. Late on election night, with Trump comfortably ahead, many swing states stopped counting ballots. In most cases, observers were removed from the counting facilities. Counting generally continued without the observers
2. Statistically abnormal vote counts were the new normal when counting resumed. They were unusually large in size (hundreds of thousands) and had an unusually high (90 percent and above) Biden-to-Trump ratio
3. Late arriving ballots were counted. In Pennsylvania, 23,000 absentee ballots have impossible postal return dates and another 86,000 have such extraordinary return dates they raise serious questions
4. The failure to match signatures on mail-in ballots. The destruction of mail in ballot envelopes, which must contain signatures
5. Historically low absentee ballot rejection rates despite the massive expansion of mail voting. Such is Biden’s narrow margin that, as political analyst Robert Barnes observes, ‘If the states simply imposed the same absentee ballot rejection rate as recent cycles, then Trump wins the election’
6. Missing votes. In Delaware County, Pennsylvania, 50,000 votes held on 47 USB cards are missing
7. Non-resident voters. Matt Braynard’s Voter Integrity Project estimates that 20,312 people who no longer met residency requirements cast ballots in Georgia. Biden’s margin is 12,670 votes
8. Serious ‘chain of custody’ breakdowns. Invalid residential addresses. Record numbers of dead people voting. Ballots in pristine condition without creases, that is, they had not been mailed in envelopes as required by law
9. Statistical anomalies. In Georgia, Biden overtook Trump with 89 percent of the votes counted. For the next 53 batches of votes counted, Biden led Trump by the same exact 50.05 to 49.95 percent margin in every single batch. It is particularly perplexing that all statistical anomalies and tabulation abnormalities were in Biden’s favor. Whether the cause was simple human error or nefarious activity, or a combination, clearly something peculiar happened.
If you think that only weirdos have legitimate concerns about these findings and claims, maybe the weirdness lies in you.
via IFTTT
InoreaderURL: SECONDARY LINK